Financial dashboards give us an instant overview of our businesses that helps us to assess our business’ financial health and financial performance. The built-in dashboards of Sage Business Cloud Accounting present us with graphs, charts and summary views. These dashboards can increase our knowledge and understanding of our businesses. This, in turn, can lead to more success for the owners, the bookkeepers, and accountants of businesses.
Check out my video below where I show all the different dashboards in Sage Business Cloud Accounting.
Dashboard
Think of dashboards as a quick bird’s eye overview of the health and performance of your business, just like a vehicle’s dashboard the gives you information about your vehicle, how fast you are traveling etc.
For example, you will have the speed indicator on your car’s dashboard which tells you how fast you are driving. Sage’s sales and purchases dashboards tell you how much sales you made in the year and how much these cost you.
The revolutions indicator on your car’s dashboard gives you information about your car’s engine, how hard it is working and when you must change gears. On Sage, you will find the cash-flow indicators like the banking charts on your dashboard that tell you at what speed money is coming in and how fast it is being spent similar to the revs on your car’s dashboard.
Your motor car’s dashboards can give measurements about the distances covered in total or for specific trips. In the same way, your sales charts, income vs expenses and profit and loss charts can tell you how your business has performed for a specific year or any period you want in comparison to prior years and other periods.
I think you get the idea of how you can use Sage’s dashboards as a guide to the health and performance of your business.
Main dashboard of Sage Business Cloud Accounting
The first widget from the top left is our quotes widget. The outstanding quotes are displayed as well as those invoiced and our pending quotes.
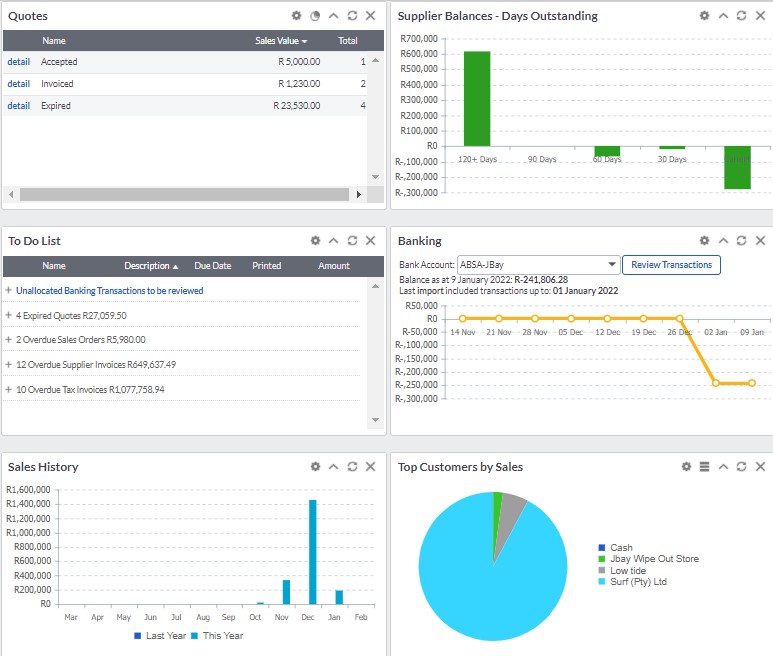
To the right next to our quotes we can see information about our money due to suppliers. This chart is also called a supplier age analysis because the chart gives us the total balances due based on how long ago we purchased the goods or services and not yet paid. This helps us to plan ahead our payments schedule and helps to manage our cash flow.
Below the quotes widget, we get a “to-do list.” This to-do list is populated from the dates that we enter on documents while we are working with it and it acts as reminders set for us to take a certain action. For example, we can put in the dates when customer invoices are due if these are not paid it is populated on our to-do list to follow up on. This is another helpful feature of Sage that can help business owners to manage their businesses
Next to our “to-do list” is our bank widget. The banking widget displays the movements of our bank account for the past few days. We can immediately see what our bank balance is and how it got there in a line graph with balance amounts set against the dates.
The next widget directly below our to-do list is a chart of our “Sales History” This chart gives us our total sales per month for the current year as well as the prior year.
Our “Top customers by Sales” pie graph next to our Sales History chart gives us the customers who bought the most from us and their slice of our “sales pie”.
We can access more dashboard options by going to the Home button. In a drop-down list, under Home, we find these other dashboards. These dashboards can also be found on the main dashboard with the only difference being that it gives us more information and options on each section than what you will find on the main dashboard.

Accountant Dashboard
Firstly we will find the Company Information. This information is gathered from the Company Settings and displays the financial year-end. The company registration and tax information. This information puts emphasis on our tax details.
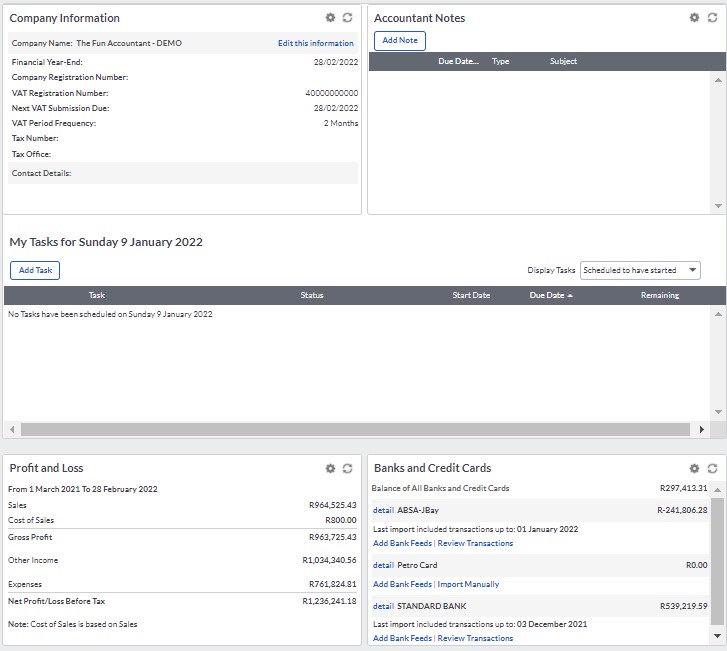
Next to the Company Information is the Accountant Notes. When you post a note to your accountant, your accountant will receive a notification where he or she can then reply to your note. With the Accountant Notes, you can keep track of your queries to your accountant and your accountant can also be informed when he or she must take certain actions like a note stating “VAT is ready for submission please submit”. Deadlines can be set with the option to add a due date to your note.
You can create tasks for yourself and your team and manage the completion of those tasks with the “task scheduler” in the section “My tasks with the current date” You can decide how you are going to display tasks in this section.
The next section is a profit and loss statement which is exactly the same as the one already shown in the main dashboard.
Moving to the right we find the “Bank and Credit Cards”. This widget does not give you a graph but a list of all your bank accounts, their balances and options to:
- See the detailed transactions.
- the ability to add bank feeds and
- access transactions to review them,
- Or to import bank transactions manually.
The Accountants dashboard gives you a platform where you can communicate with your accountant and where your accountant can go, to perform specific actions needed by your business. This feature is amazing for both the owners of the businesses as well as their accountants.
Customer Dashboard
The next dashboard in our drop-down list from our home button is the Customer Dashboard. This dashboard provides us with important information about our customers, who they are, how much they have bought from us and also how much they owe us in instances where we sell on credit.
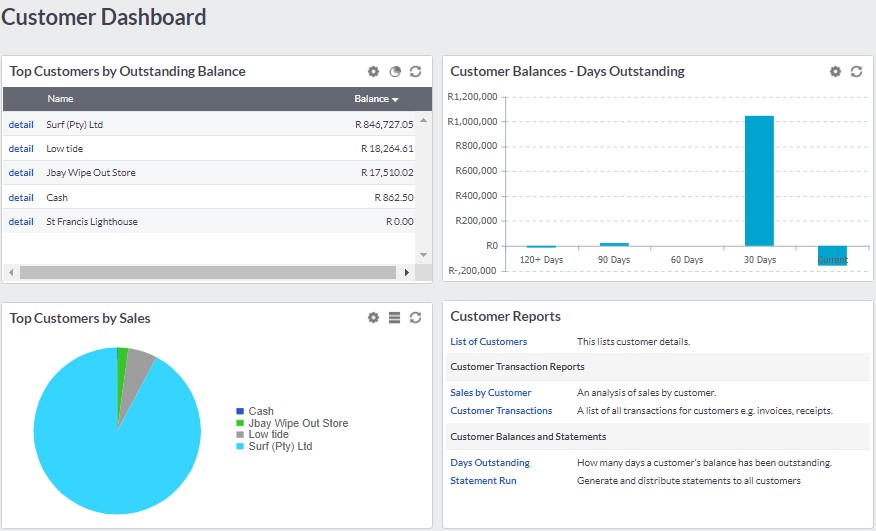
The first widget from the top left is “The Top Customers by Outstanding Balance ”. This widget provides us with the customer names that owe us the most money and the amounts due to us are displayed in a line. We can access the detailed transactions that resulted in this balance by clicking on the blue word “detail” next to the customer’s name.
Right next to this widget is our “Customer Age Analyses” displaying the total amount of sales bought on credit from us based on the date bought. These amounts due are divided into current amounts due, 30 days old, 60 days old, 90 days old and then money owed to us which is outstanding for 120 days or more.
We can also get our Top Customers by Sales in a pie graph, displaying the customers that bought the most from us in the current year. If we hover over the pie graph the total sales amount for each customer is displayed.
The last widget on the Customer Dashboard is the “Customer Reports” section where you can quickly navigate to a list of your customers, an analysis of sales by customer, a list of transactions for customers. How many days customers’ balances have been outstanding which is a comprehensive list compared to only the chart above. From this widget, you can also generate and distribute customer statements.
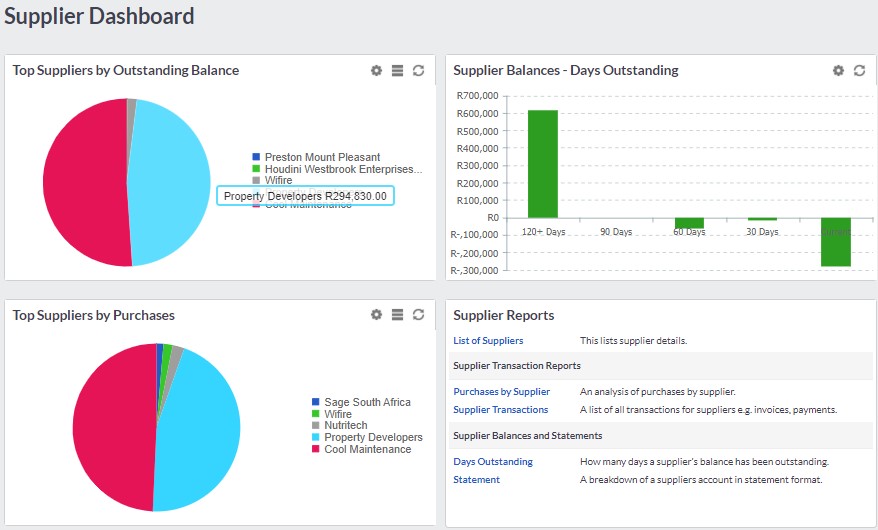
Supplier Dashboard
Back to our drop-down list from the “Home” button, we get the Supplier Dashboard which is a mirror copy of the customer dashboard only this time it is focused on what we have bought, from who we have made the most purchases and who do we owe the most money and how old the money to suppliers is that we owe. This dashboard tells us a lot about purchases and future payments that will affect our cash outflow.
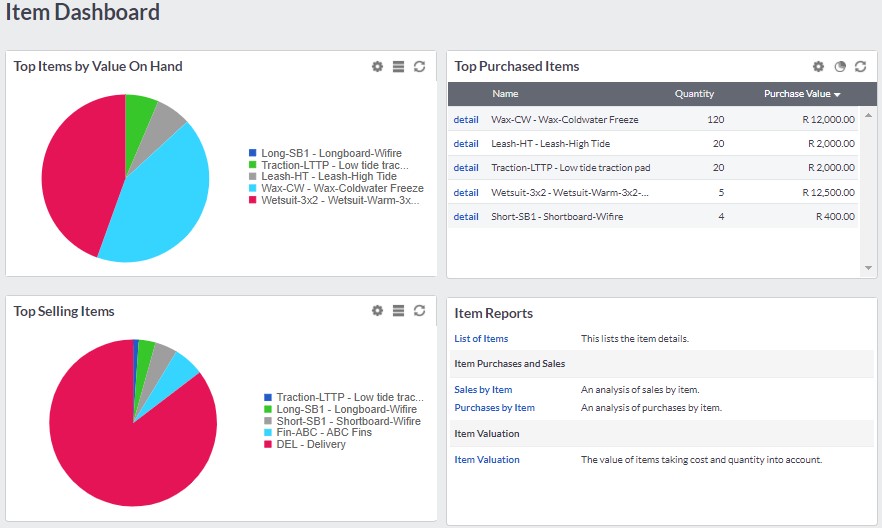
Item Dashboard
The second last dashboard in the drop-down list is the item dashboard which gives us information about items like products and services that we have set up as inventory items in Sage. We also get sales and purchase information of those items as well as an Item valuation report. The valuation report gives us a list of items on hand and the value thereof.
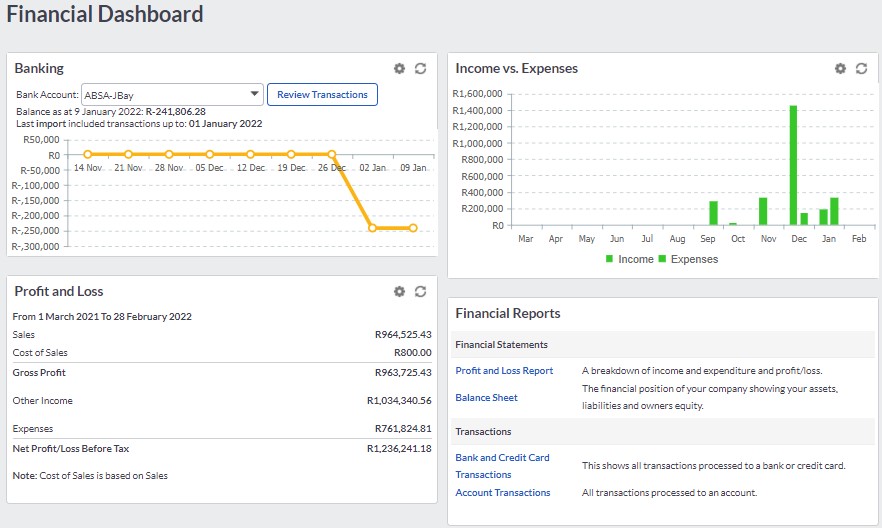
Finacial Dashboard
Our last dashboard is the financial dashboard which gives us information about the financial health of our business, the money in our bank account, Income vs Expenses as well as the ability to drill down on other specific reports like Balance Sheets and transaction reports which display detailed transactions of our business in their respective categories.
Hopefully, this article will give you a good idea about the power of dashboards. Dashboards condense business data into understandable graphic views, which is a great help for many people and their businesses. The dashboards of Sage Business Cloud Accounting are good examples of how you can use dashboards in your business. If you would like to try it yourself you can sign up for the Sage Business Cloud Accounting’s 30-day free trial in the link above.